Cardano dips toward $0.20 amid negative derivatives pressure
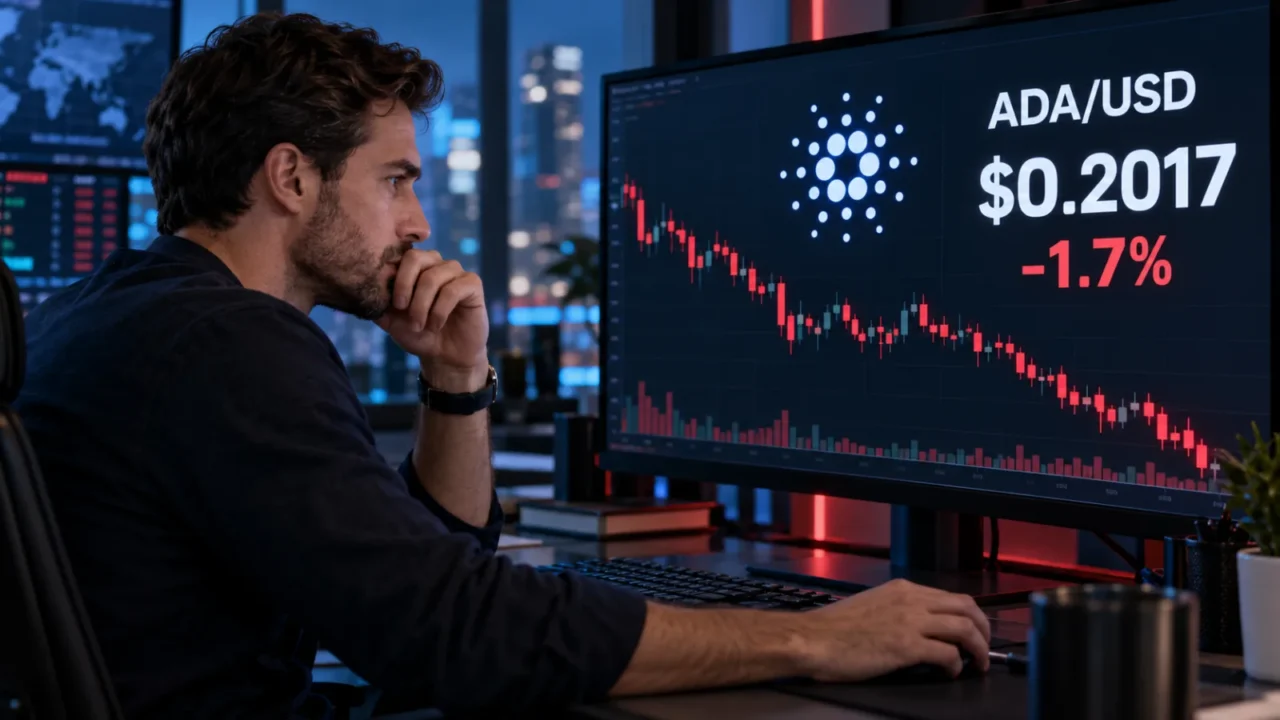
Cardano traded near $0.201, extending losses amid negative derivatives pressure, a bearish funding rate, and heavy selling activity as technical indicators point to ongoing market weakness.

Key takeaways
- Cardano traded near $0.201 on Monday, extending its downward movement following three consecutive negative weeks.
- The funding rate has shifted negative to -0.0032%, highlighting the prevailing bearish sentiment in derivatives.
- ADA encounters initial resistance at $0.213, while sluggish momentum leaves potential recovery efforts exposed to further downside.
Cardano dropped beneath $0.202 on Monday as ongoing selling pressure affected its technical indicators, spot market, and derivatives.
ADA hovered around $0.201 on the back of three straight losing weeks, accumulating a drop of more than 20% since early October. The digital asset continues to trade under several critical moving averages, indicating that buyers have yet to spark a lasting turnaround.
Even though momentum is nearing oversold levels, the overall market environment still favors sellers. Any short-term bounce must clear multiple resistance barriers before the outlook can significantly improve.
Derivatives positioning tilts toward shorts
Data from CoinGlass revealed Cardano’s long-to-short ratio at 0.92 on Monday, marking a level close to its lowest point in over a month.
A metric falling under one shows that short positions outnumber long positions within the tracked dataset. This figure points to a cautious market environment where traders continue leaning into downside exposure.
In addition, ADA’s funding rate moved into negative territory at -0.0032%. A negative funding rate indicates that short sellers are paying long traders to hold their positions, which aligns with greater demand for bearish exposure.
Combined, these metrics reinforce the prevailing downward trend, although neither guarantees that the losses will persist.
CryptoQuant summary indicators paint a similarly cautious picture, pointing out large whale orders along with overheating conditions inside Cardano’s futures market. Spot and futures metrics also highlight sell-side dominance, signaling that selling activity extends past leveraged positions alone.
While large orders by themselves do not confirm the specific direction of whale activity, they—alongside the observed selling imbalance and negative funding—provide little evidence of a decisive shift toward heightened buying interest.
ADA remains below key moving averages
Cardano maintains a bearish daily technical structure, trading under its 50-day, 100-day, and 200-day Exponential Moving Averages.
These averages are positioned roughly between $0.218 and $0.237, creating a sequence of overhead hurdles.
The Relative Strength Index registers at 33, sitting just above the standard oversold level of 30. This value highlights ongoing weakness while offering room for a brief corrective bounce.
The Moving Average Convergence Divergence indicator holds in negative territory, with the MACD line resting below its signal line. Its muted bearish configuration offers minimal confirmation that momentum is shifting in favor of buyers.

The broken trendline near $0.213 serves as Cardano’s immediate resistance level. Beyond that point, buyers would encounter the 100-day EMA at $0.218 and the 50-day EMA at $0.224. Additional resistance rests near $0.236, bolstered by the nearby 200-day EMA at $0.237.
A sustained push through that cluster would bring $0.245 into view, with $0.299 acting as a much farther barrier.
Looking downward, $0.200 serves as the primary psychological level as ADA changes hands just above it.
For buyers, reclaiming $0.213 would mark a preliminary step forward. Achieving a more substantial recovery requires ADA to push past its moving averages alongside stronger momentum and a reduction in selling pressure.
Frequently Asked Questions
What is the current trading price of Cardano (ADA)?
Cardano has been trading near $0.201, sitting just above the critical psychological reference level of $0.200.
Why are derivatives signaling a bearish outlook for ADA?
CoinGlass data shows a long-to-short ratio of 0.92, indicating that short positions outweigh longs. Furthermore, the funding rate has dropped to a negative -0.0032%, meaning short traders are paying longs to keep their positions open.
What are the key resistance levels Cardano needs to break?
ADA faces initial resistance at the former trendline near $0.213. Higher resistance zones include the 100-day EMA at $0.218, the 50-day EMA at $0.224, and a broader resistance area around $0.236 to $0.237.
What do technical indicators say about Cardano’s momentum?
The Relative Strength Index (RSI) is at 33 (just above the oversold threshold of 30), and the MACD remains negative with the MACD line below the signal line, pointing to persistent weakness and subdued buying momentum.